Introduction
Pandas is a great python library for doing quick and easy data analysis. In this tutorial we are going to show you how to download a .csv file from the internet and we are going to do a simple plot to show the information. Additionally we are going to improve the default pandas data frame plot and finally save it to a file.
Recommended tutorial
We recommend to do the anaconda python tutorial for setup a data analysis development environment.
Step 1: Installation
conda install pandas requests ipython
Step 2: Download the data for analysis
We are going to download the dataset using python, but this step is optional. You can check for more free datasets here.
Start ipython console with the command ipython
import requests
url = 'https://tutorials.technology/data/world-population.csv'
response = requests.get(url)

with open('world-population.csv', 'wb') as csv_file:
    csv_file.write(response.content)
Step 3: Use pandas read_csv to load data
Now we are going to use read_csv to load the csv data into a pandas data frame. To use the year for X values, we use the parameter index_col. index_col is an integer which referers to the column number to use as an index of the data. In this particular case que have a csv with two columns.
import pandas
population = pandas.read_csv('world-population.csv', index_col=0)
Step 4: Plotting the data with pandas
import matplotlib.pyplot as plt
population.plot()
plt.show()
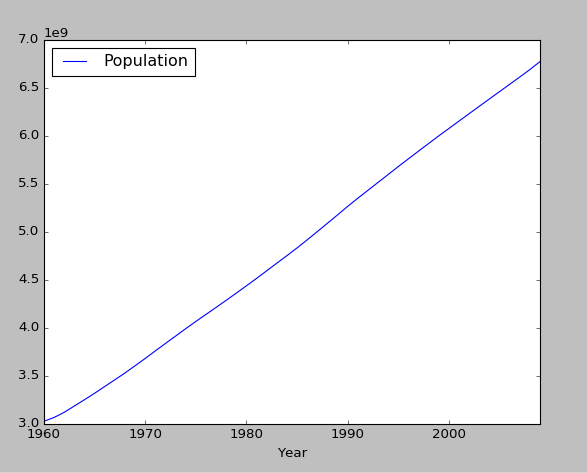
At this point you shpuld get a plot similar to this one:

Step 5: Improving the plot
First we are going to add the title to the plot. Then we set other parameters to improve the plot: * lw : Line width. The default value is usually low and we set it to 2. * colormap : We use the jet color map, but a a complete list of colormap is available here. * marker : Markers are used to let the user know where is the data point. for a complete list of markers check here. * markersize : The size of the marker.
Finally we set the x and y axis labels to the pandas data frame plot. Add the parameter title to the plot method.
plot = population.plot(title='World Population', lw=2, colormap='jet', marker='.', markersize=10)
plot.set_xlabel("Year")
plot.set_ylabel("Population")
The plot should looks like this one:

Step 6: Saving the plot to an image
To save the plot to a file we just need to change the last python line. Here is the full example of the pandas data frame plot that will be saved to a file called population.png
import matplotlib.pyplot as plt
import pandas
population = pandas.read_csv('world-population.csv', index_col=0)
plot = population.plot(title='World Population', lw=2, colormap='jet', marker='.', markersize=10)
plot.set_xlabel("Year")
plot.set_ylabel("Population")
plt.savefig('population.png')
The final result should be like this:

Appendix: Error UnicodeDecodeError: 'utf-8' codec can't decode byte
If you get an error like this one while using pandas.read_csv:
UnicodeDecodeError: codec can't decode byte 0xa4 in position : invalid start byte
You need to use the encoding parameter of read_csv
pandas.read_csv('world-population.csv', encoding='utf8')
Usually utf8 solves the encoding problem, but it could be that the file is using other type of encoding.