Step 1: Installing scikit-learn
We require the user to have a python anaconda environment already installed.
conda install scikit-learn
Test that scikit-learn was correctly installed::
from sklearn.linear_model import LinearRegression
Step 2: Generate random linear data
We are going to choose fixed values of m and b for the formula y = x*m + b. Then with a random error of 1% will generate the random points. Usually you will not known in advance this information, we generate this data for teaching purposes. With this points we are going to use sklearn to create a linear regresion and verify how close we got to the fixed m and b values that we choose.
import random
# let's create a linear function with some error called f
def f(x):
    res = x* 25 + 3
    error = res * random.uniform(-0.01, 0.01) # you can play with the error to see how it affects the result
    return res + error

values = []
# now using f we are going to create 300 values.
for i in range(0, 300):
    x = random.uniform(1, 1000)
    y = f(x)
    values.append((x, y))
In our code we first define the f function, which is a linear function. In particular this function adds +/- 1% of random error to the result, if not we are going to get a straight line. Then we generate 300 random point that we will use to train a model.
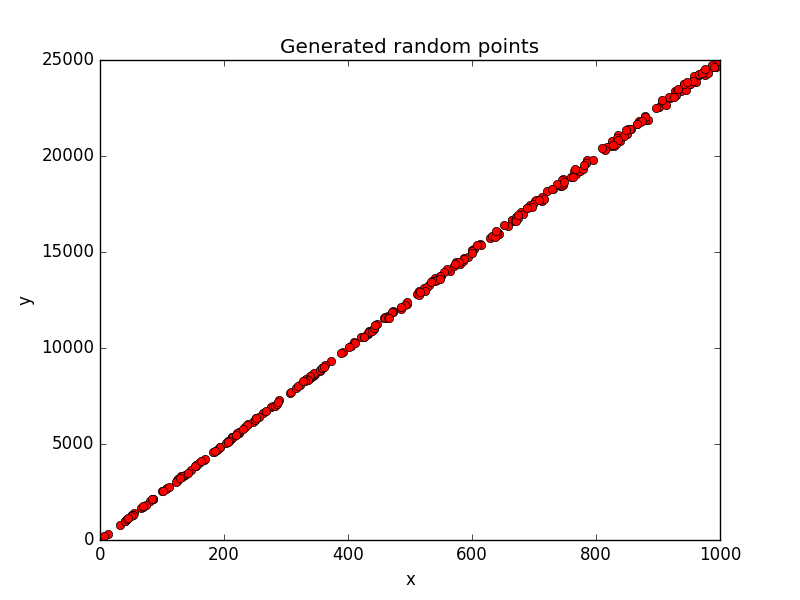
If we plot the point we will get:

Step 3: Use scikit-learn to do a linear regression
Now we are ready to start using scikit-learn to do a linear regression. Using the values list we will feed the fit method of the linear regression. Also we separate the data in two pieces: train and test. With thet in step 5 we are going to measure the error of the trained linear model.
from sklearn import linear_model
regr = linear_model.LinearRegression()
# split the values into two series instead a list of tuples
x, y = zip(*values)
max_x = max(x)
min_x = min(x)
# split the values in train and data.
train_data_X = map(lambda x: [x], list(x[:-20]))
train_data_Y = list(y[:-20])
test_data_X = map(lambda x: [x], list(x[-20:]))
test_data_Y = list(y[-20:])
# feed the linear regression with the train data to obtain a model.
regr.fit(train_data_X, train_data_Y)
# check that the coeffients are the expected ones.
m = regr.coef_[0]
b = regr.intercept_
print(' y = {0} * x + {1}'.format(m, b))
The output should be similar to:
y = 25.177610247385566 * x + -7.94027696509
Step 4: Plot the result
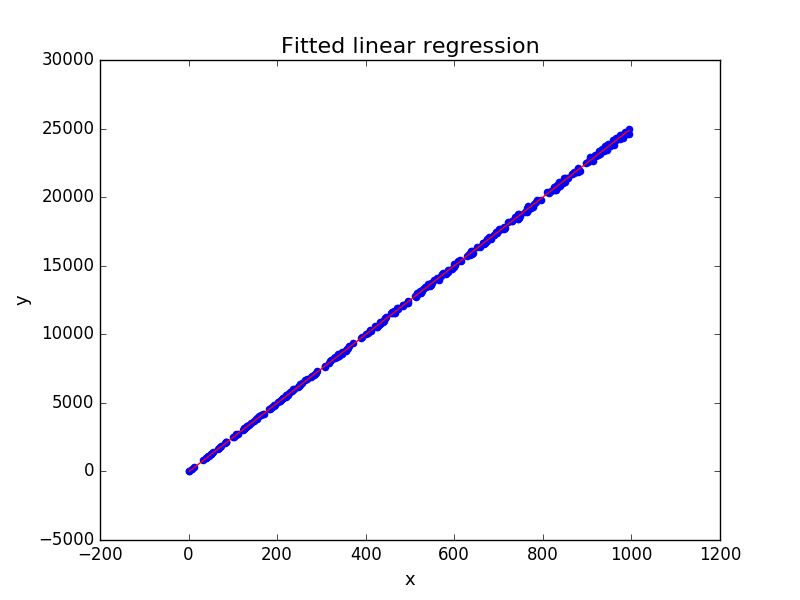
Now we are going to plot the regression fitted:
import matplotlib.pyplot as plt

# now we are going to plot the points and the model obtained
plt.scatter(x, y, color='blue')  # you can use test_data_X and test_data_Y instead.
plt.plot([min_x, max_x], [b, m*max_x + b], 'r')
plt.title('Fitted linear regression', fontsize=16)
plt.xlabel('x', fontsize=13)
plt.ylabel('y', fontsize=13)

Step 5: Measure the error
import numpy as np
# The mean squared error
print("Mean squared error: %.2f" % np.mean((regr.predict(test_data_X) - test_data_Y) ** 2))
# Explained variance score: 1 is perfect prediction
print('Variance score: %.2f' % regr.score(test_data_X, test_data_Y))
The output should be similar to:
Mean squared error: 3352.52
Variance score: 1.00
Conclusion
Simple linear regression is a statistical method that allows us to summarize and study relationships between two or more continuous (quantitative) variables.
It's a good idea to start doing a linear regression for learning or when you start to analyze data, since linear models are simple to understand. If a linear model is not the way to go, then you can move to more complex models.
Linear regresion tries to find a relations between variables.
Scikit-learn is a python library that is used for machine learning, data processing, cross-validation and more. In this tutorial we are going to do a simple linear regression using this library, in particular we are going to play with some random generated data that we will use to predict a model.
When to use linear regression
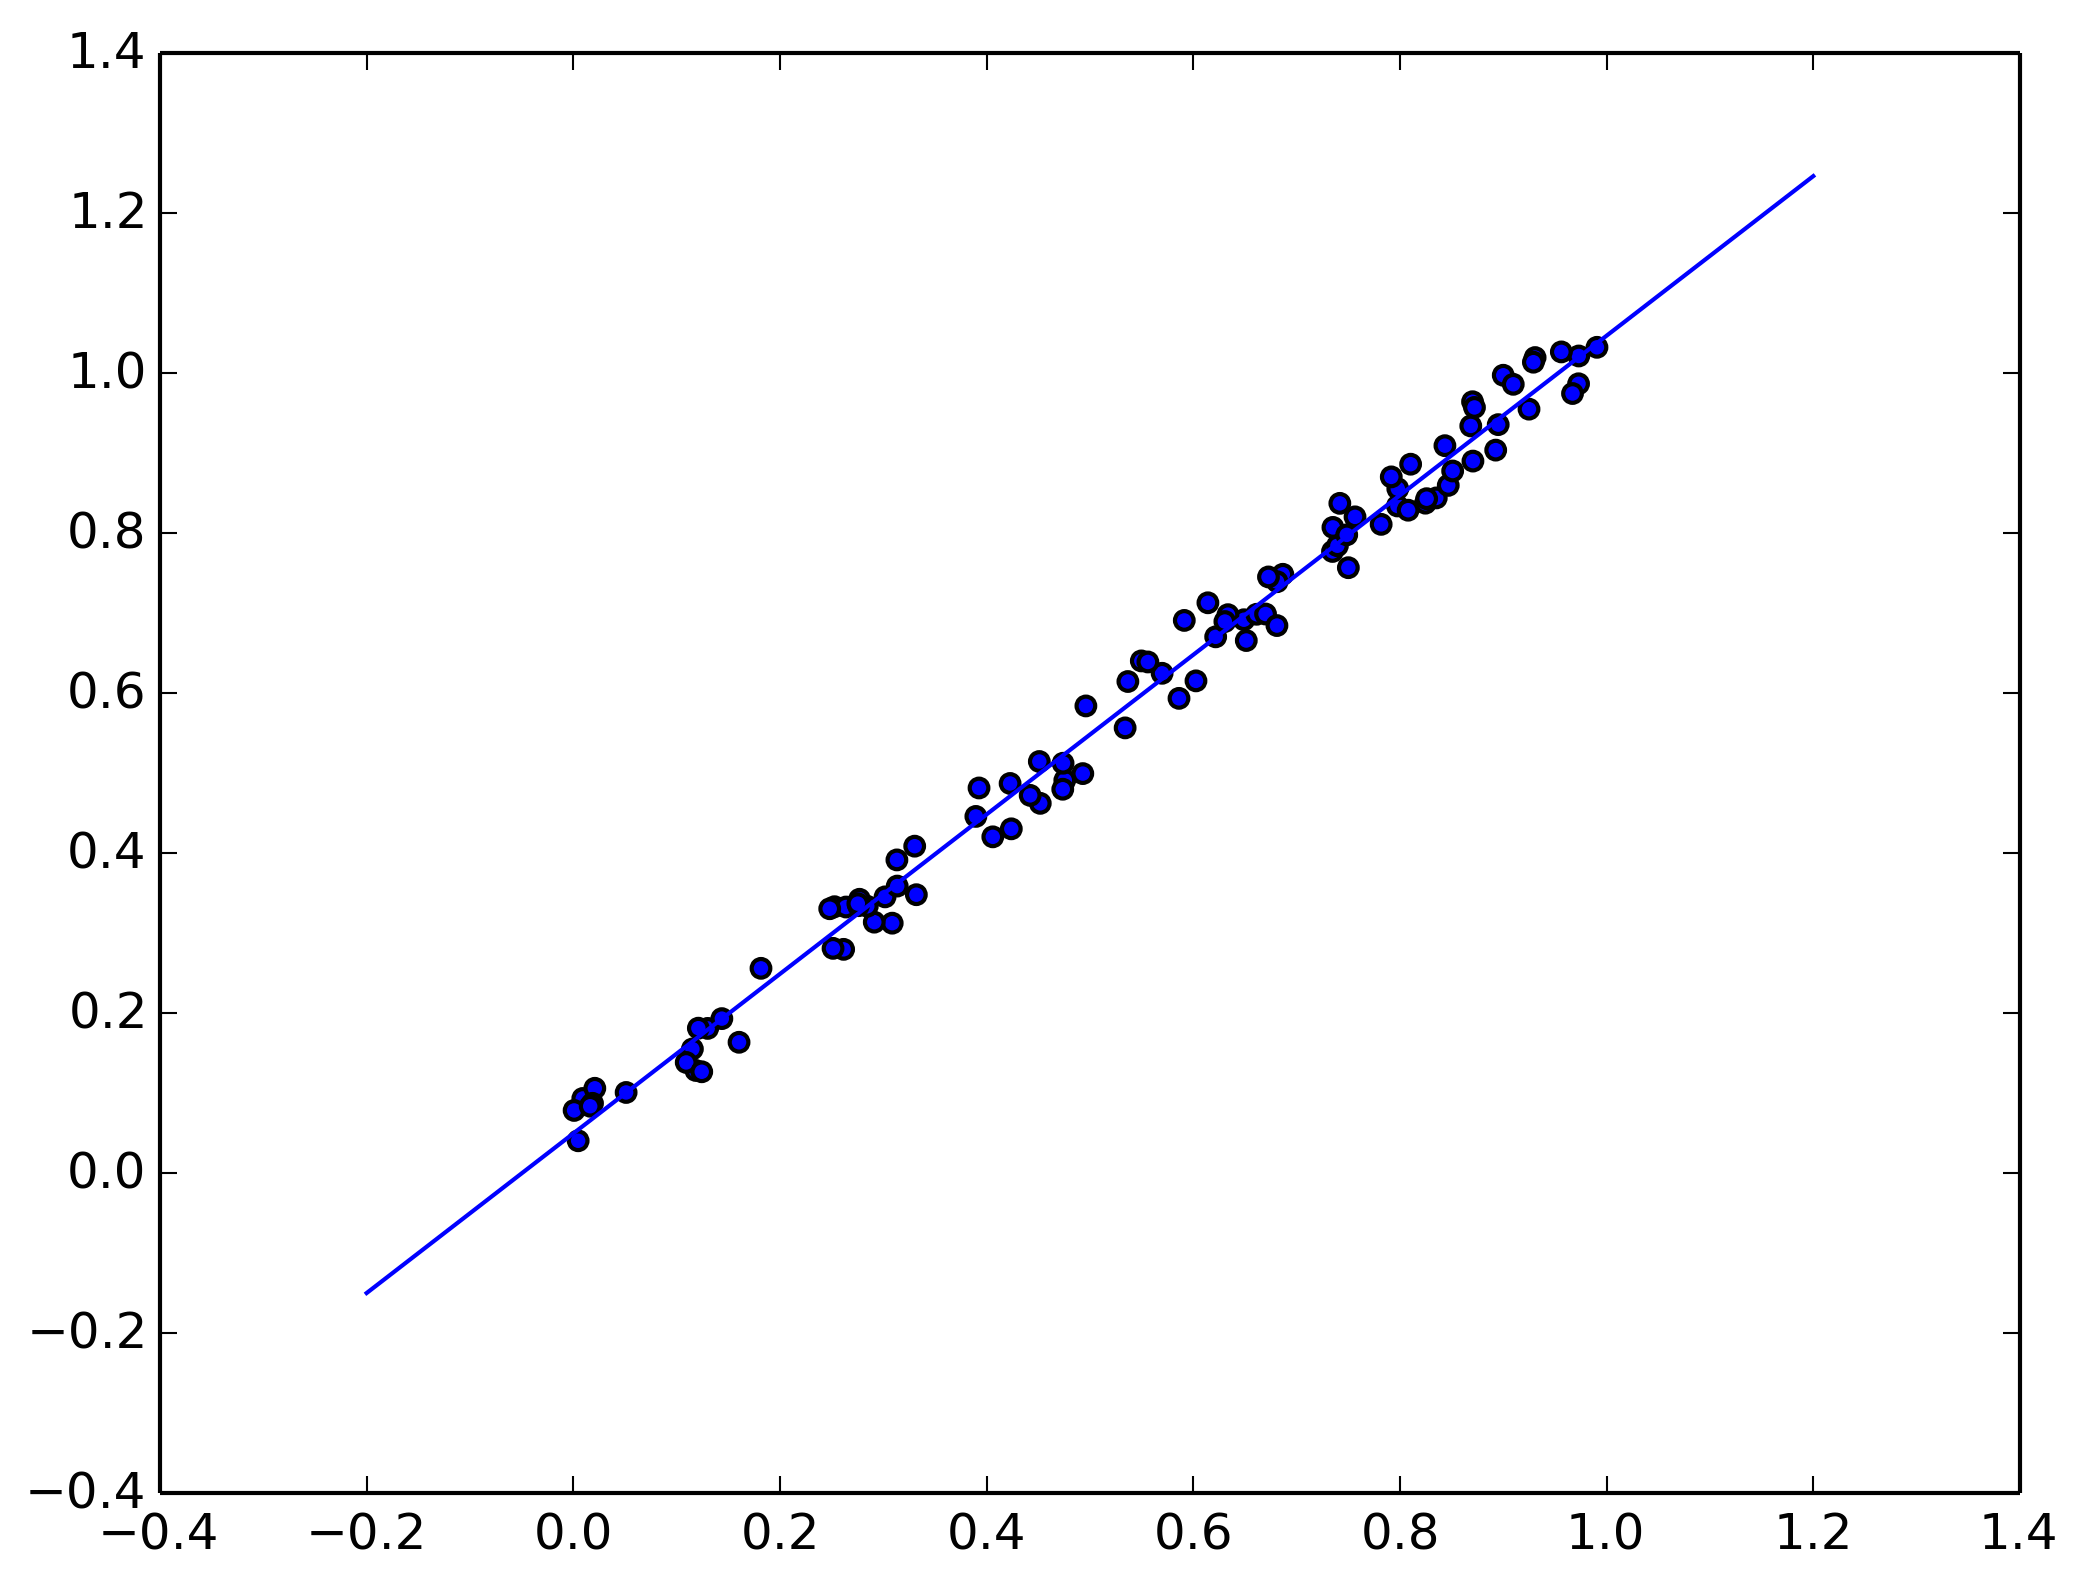
When you think there is a relation between the variable to analyze (X and Y), like we see in figure 0.
What we are going to fit is the slope (m) and y-interceptor (b), so we are going to get a function like: y = x*m + b.
In this case the linear combination only has x since we are using 2D data, but the general linear model where y is the predicted model is:
Appendix
How to fix error Error: ImportError: numpy.core.multiarray failed to import
try to upgrade numpy with:
conda install numpy
If you are not using anaconda:
pip install -U numpy
How to fix ValueError: Found arrays with inconsistent numbers of samples
Check that the X values of the fit function is a list of list of possible values for each Y.